
I joined Geographical Information Science Lab in the Department of Geography in National Taiwan University. My academic supervisor is Professor Tzai-Hung Wen, Ph.D.
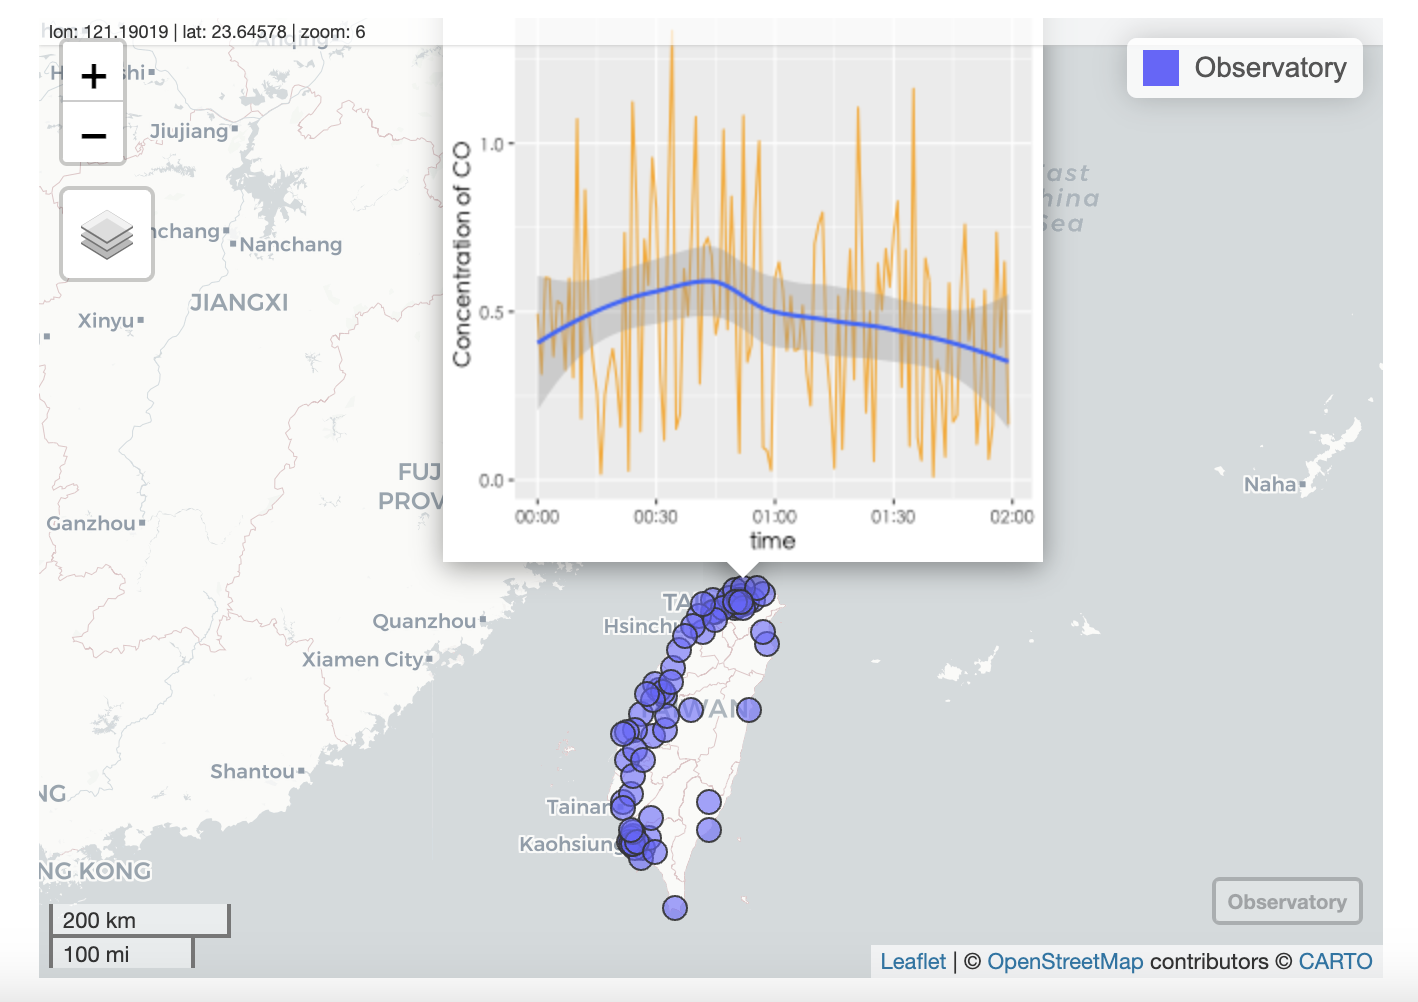
This work use R langauge to code and draw four line charts and time series in an interactive map sustem which provide pop-up window for more information regarding air quality in Taiwan.
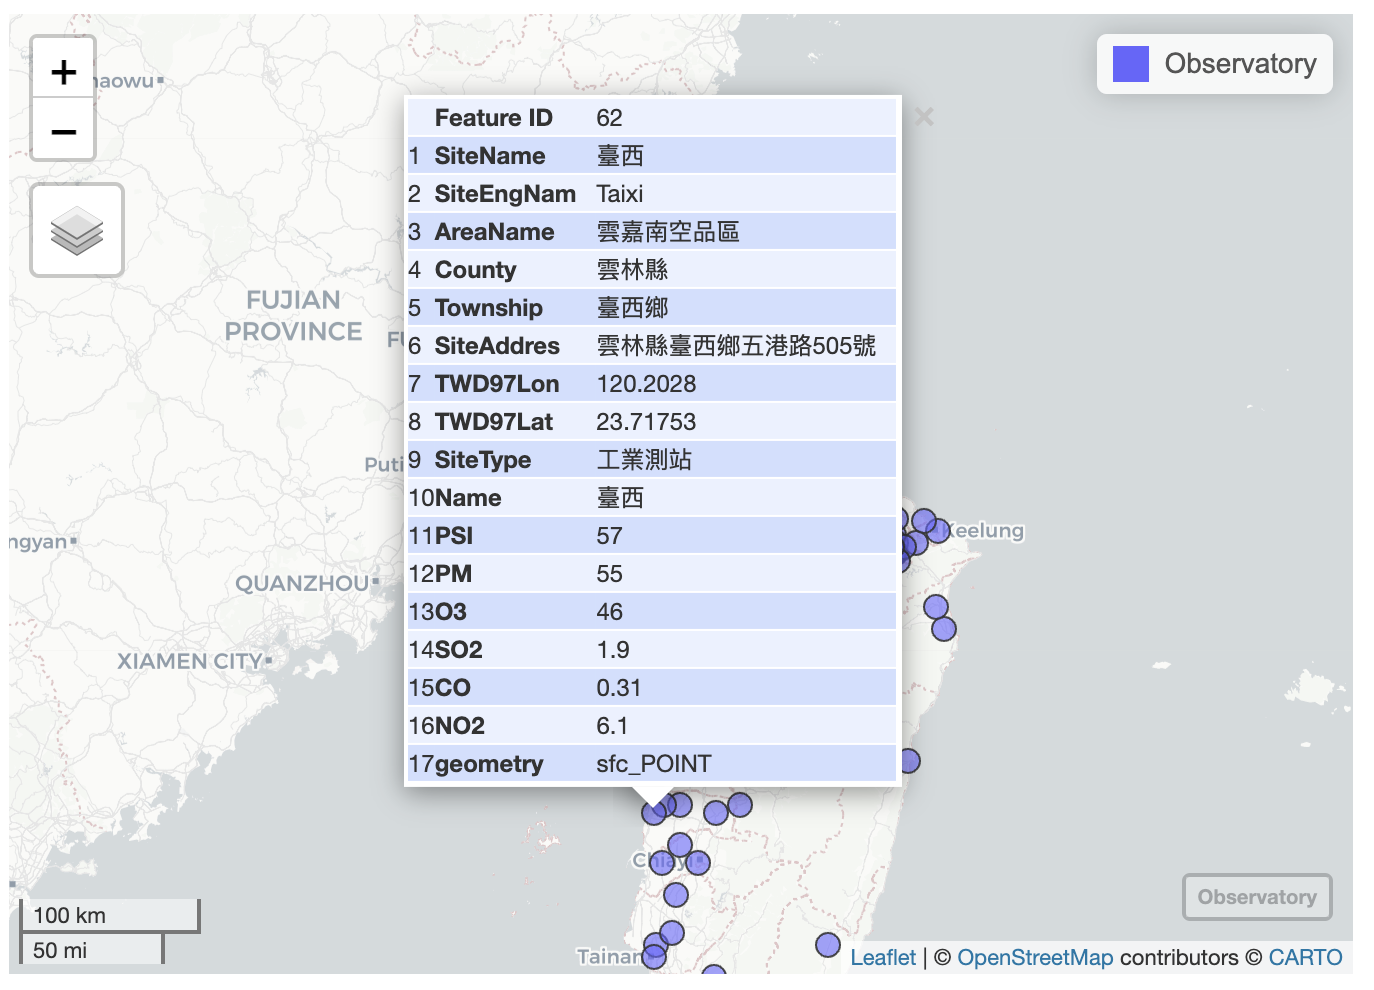
2021-1 Interactive Data Visualization - Project 1: Air Quality in Taiwan
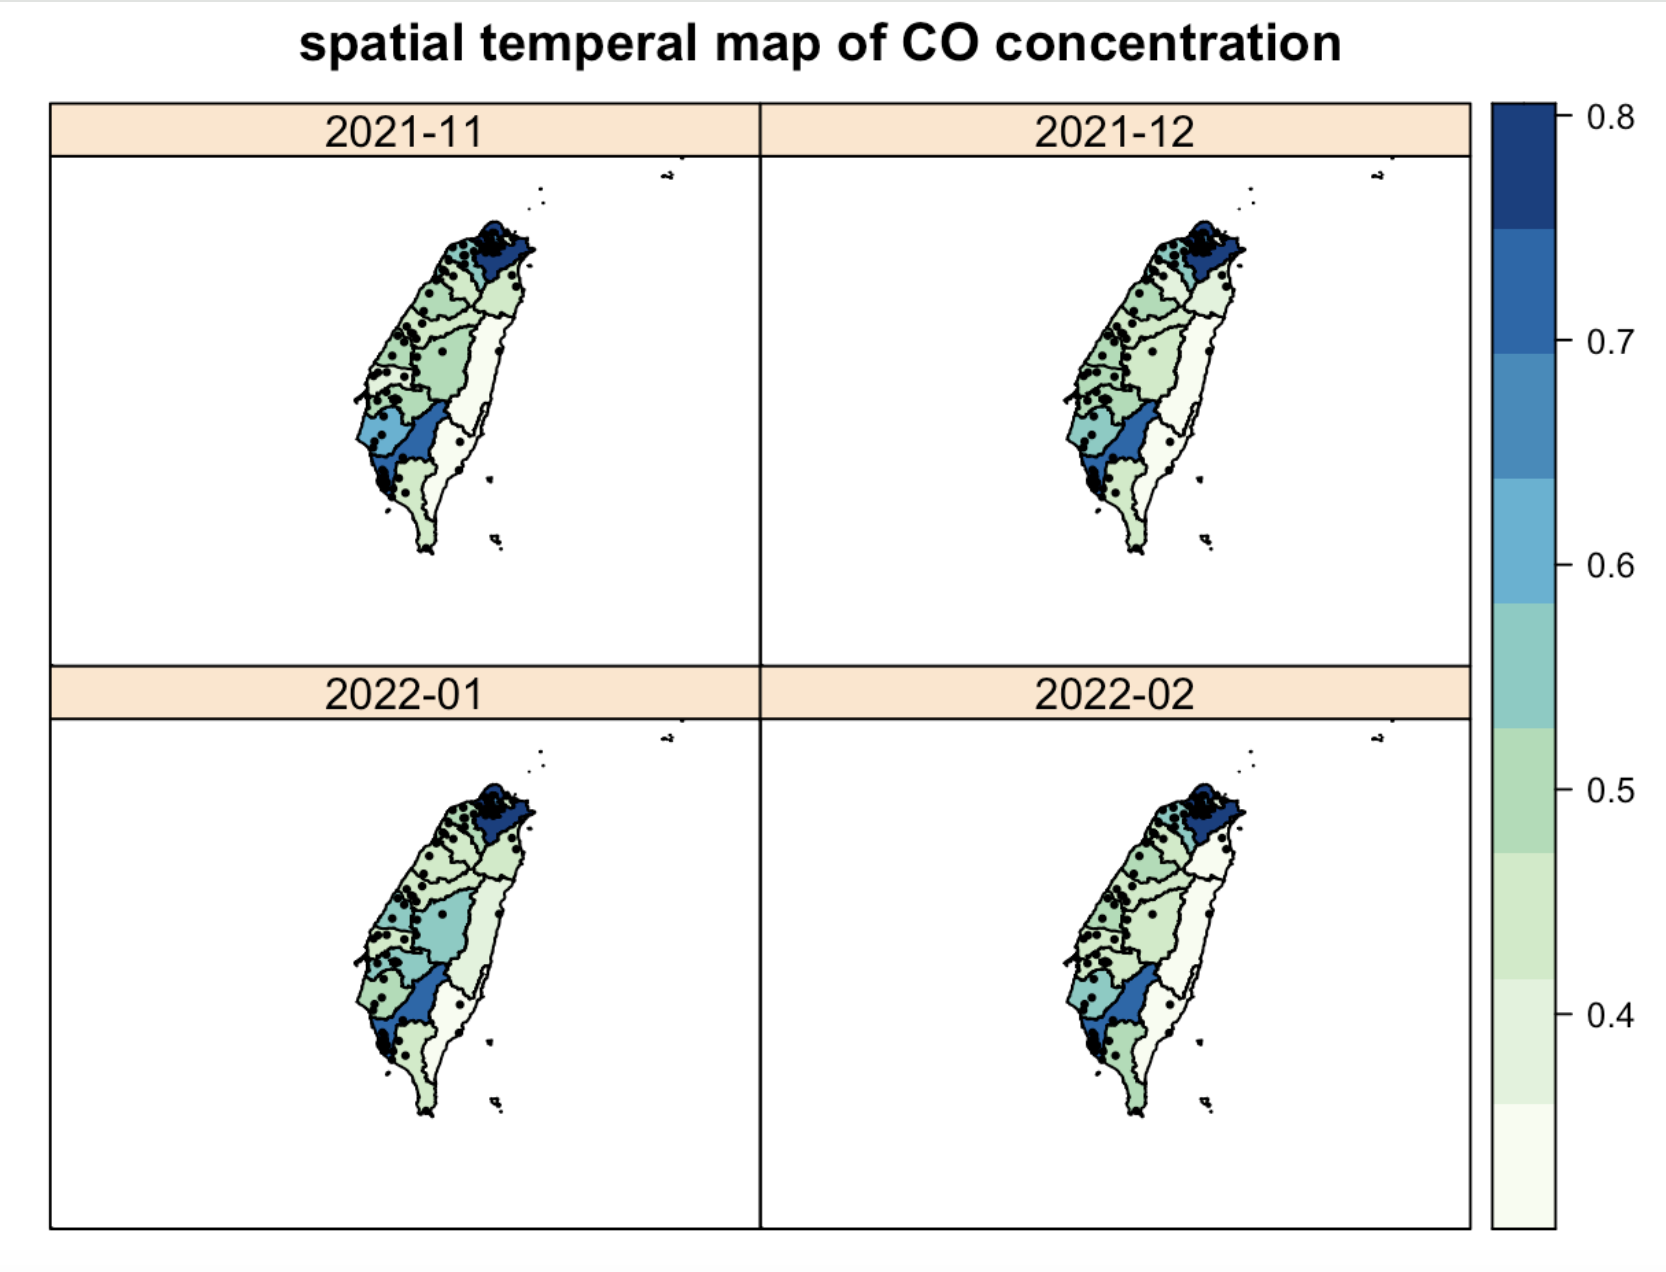
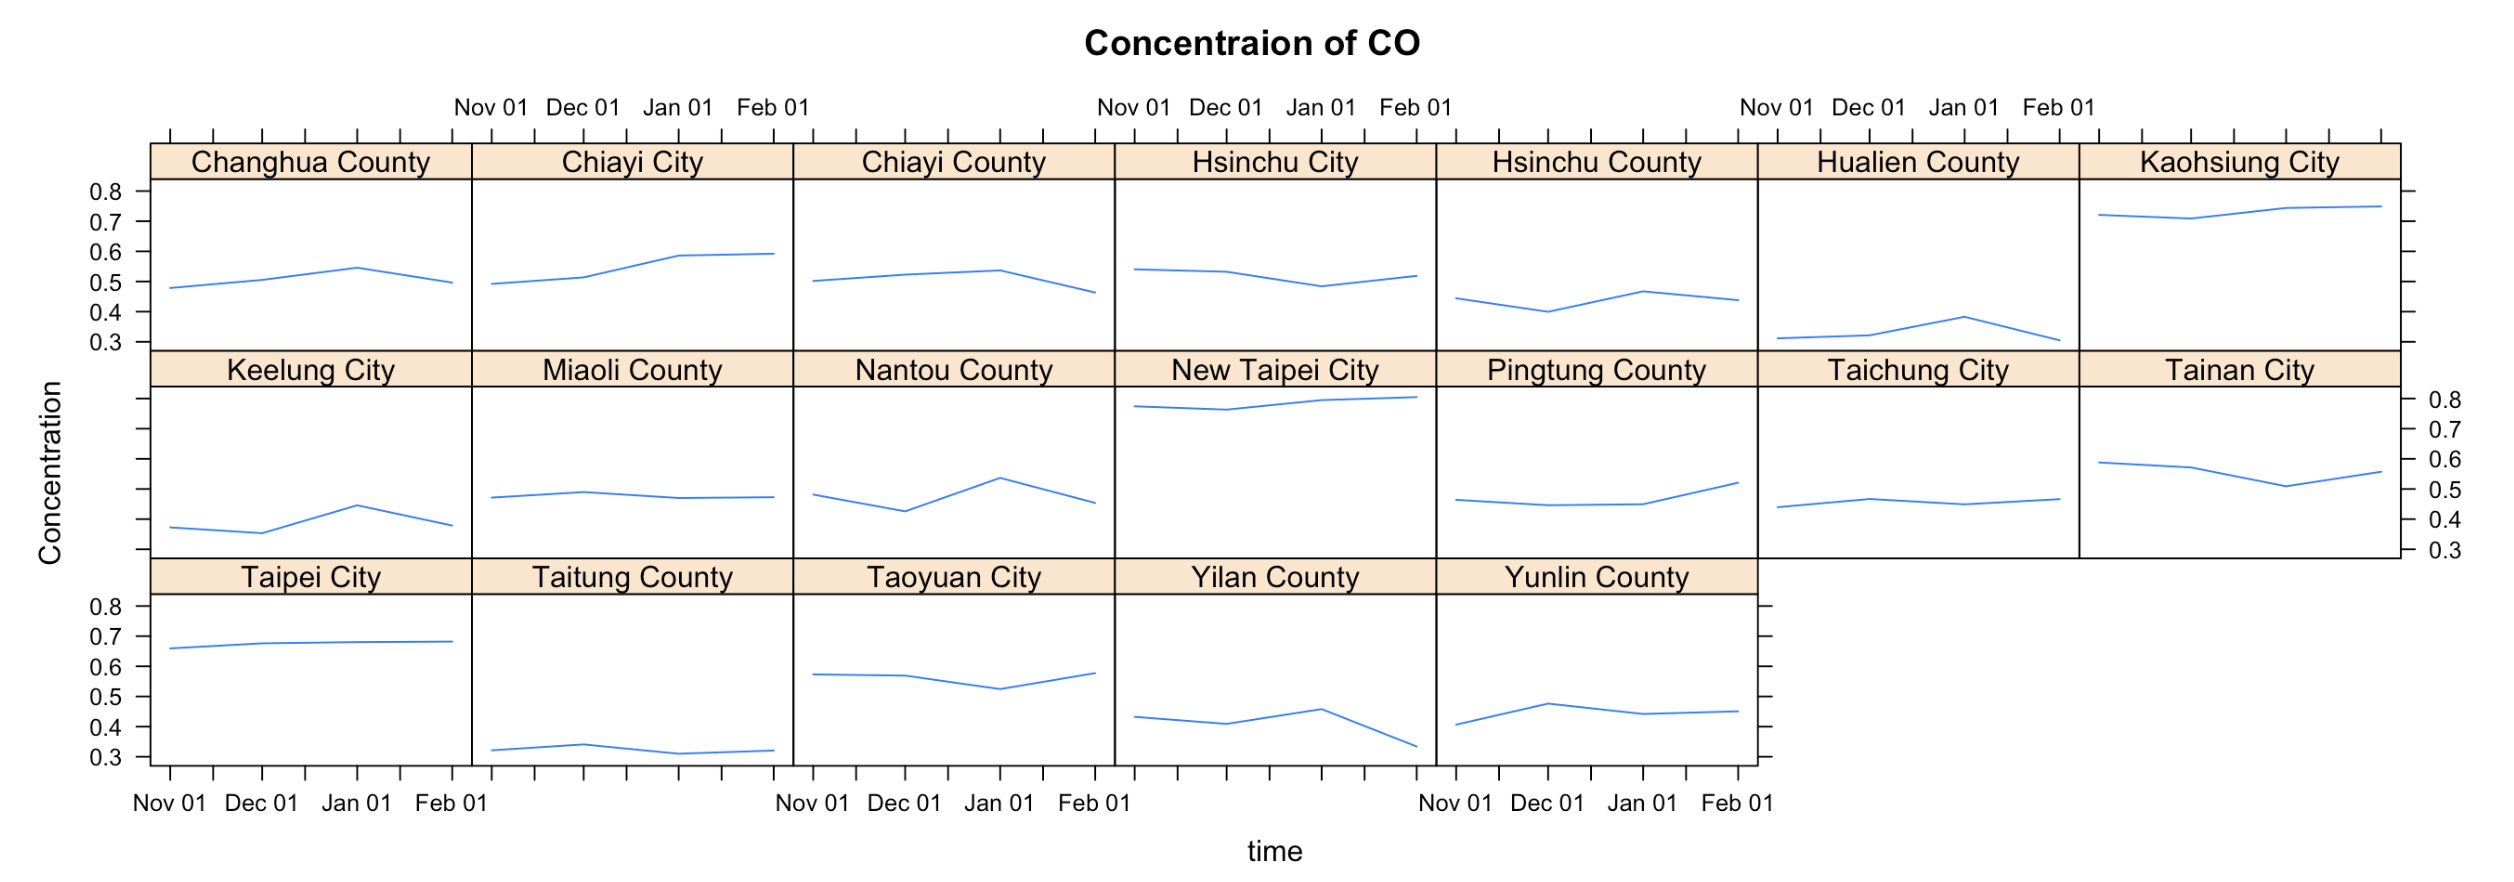
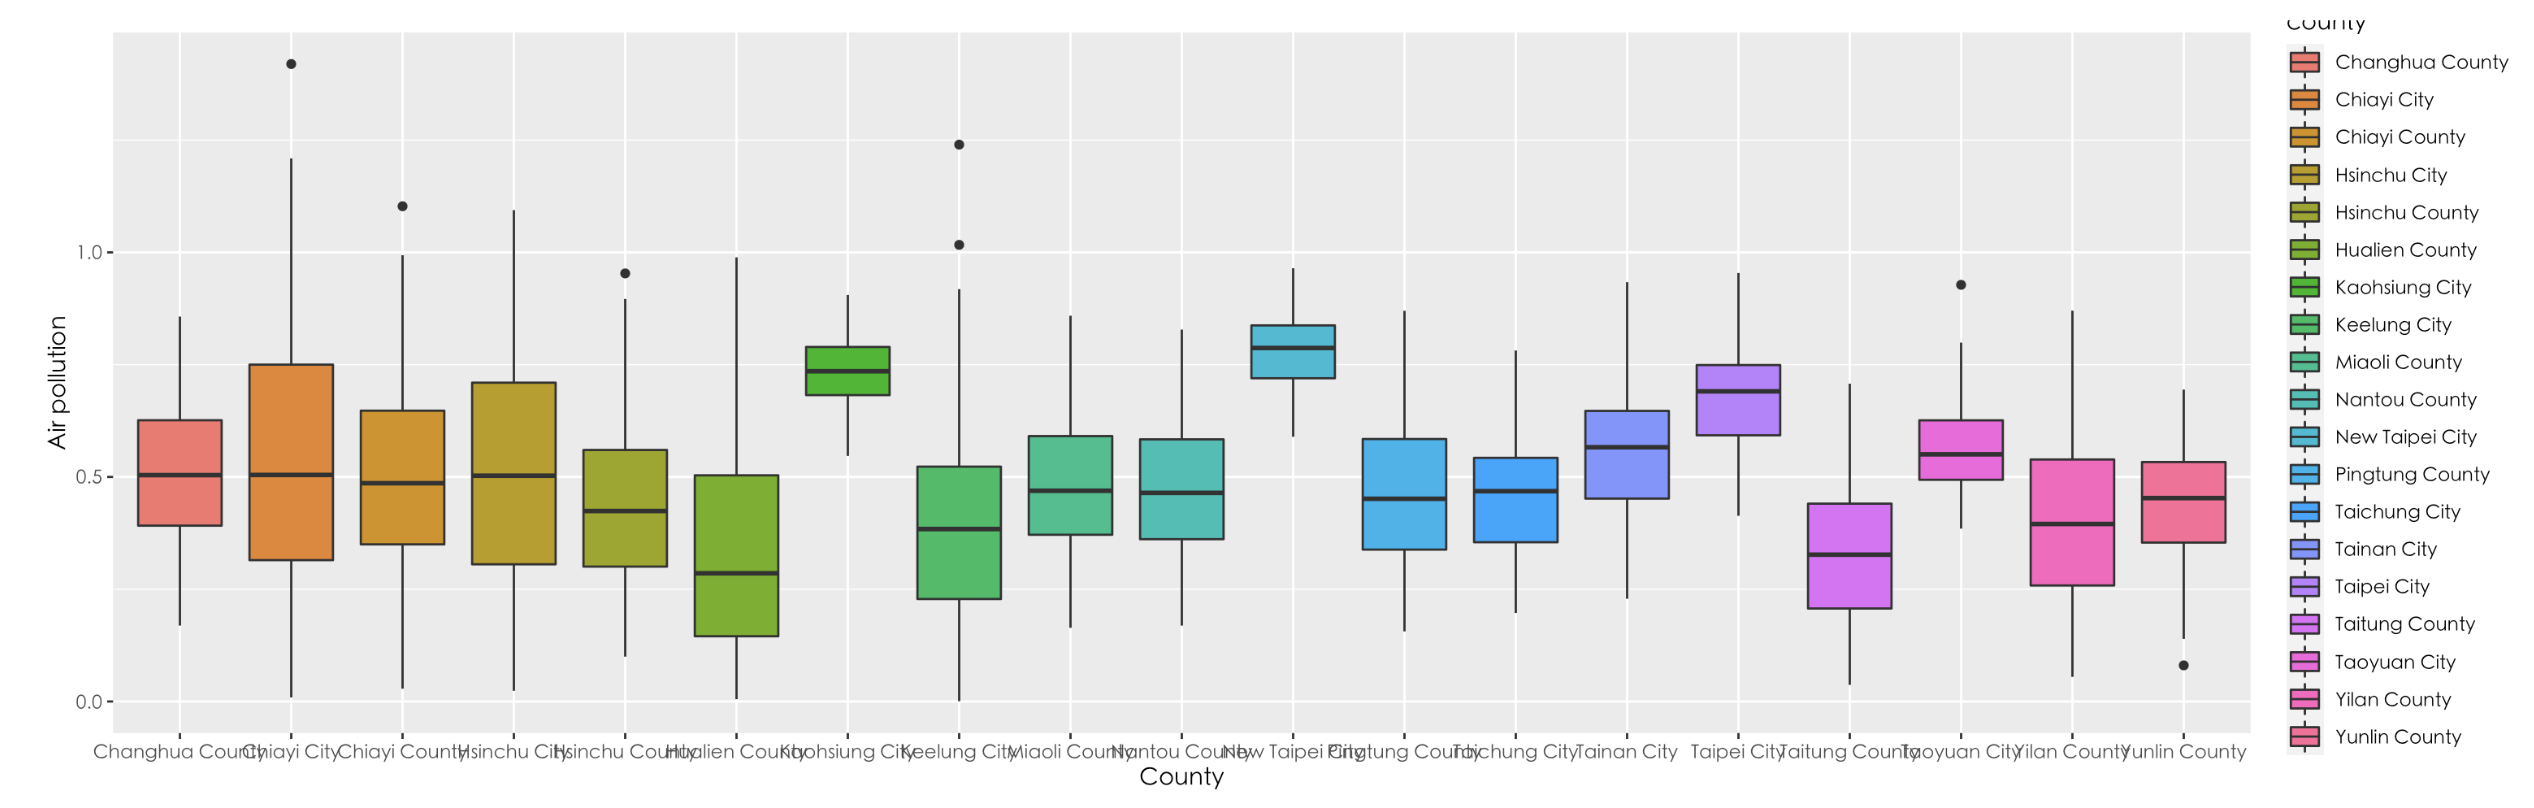
This work use R langauge to code and draw charts for data visualization. Data: EPA_daily.csv Comparing county-level monthly air pollution in time and space from Taiwan EPA monitoring data Original scale: X-Y point (space); daily (time) Upscaling to county-level (space) and monthly (time) Plotting [1] Using stplot() for plotting county-level monthly air pollution in time and space [2] Creating boxplot for comparing air pollution among counties
2021-1 Spatiotemporal Data Visualization - Project 2: Stories and House Price in Taipei
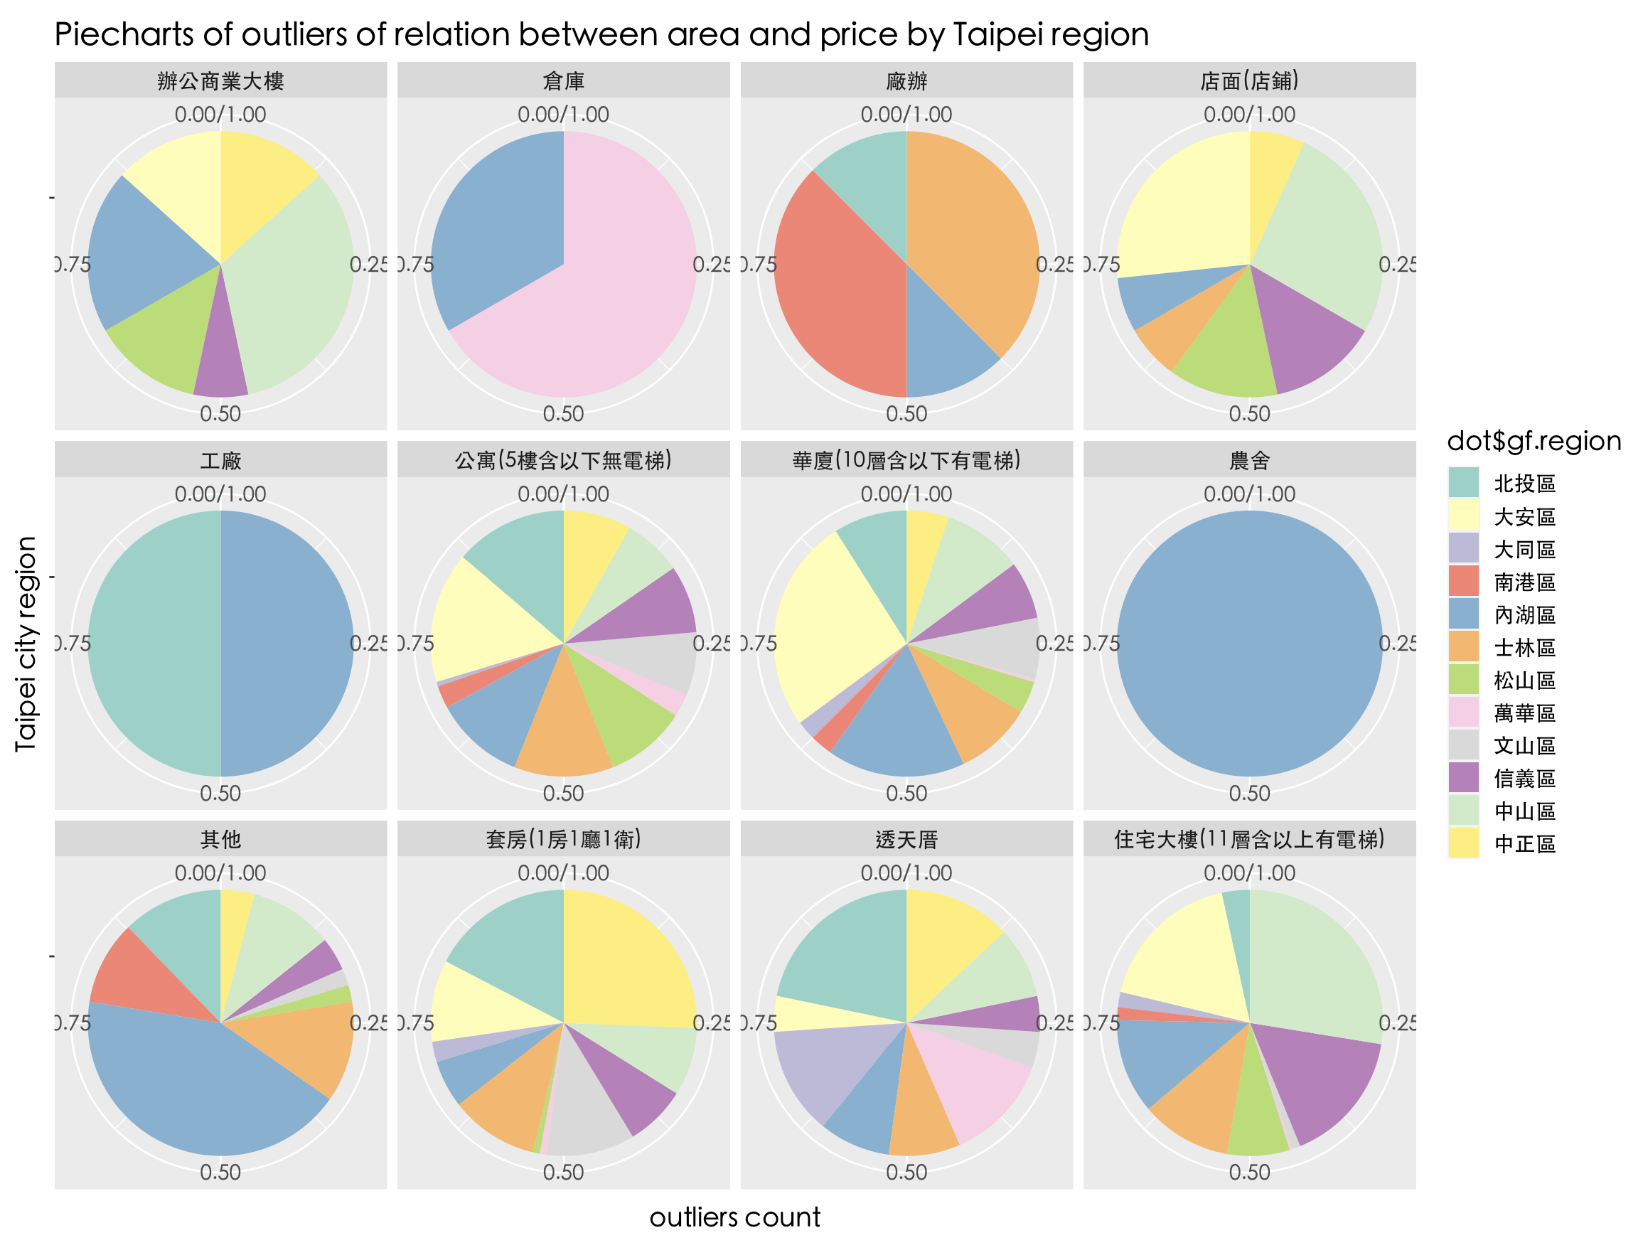
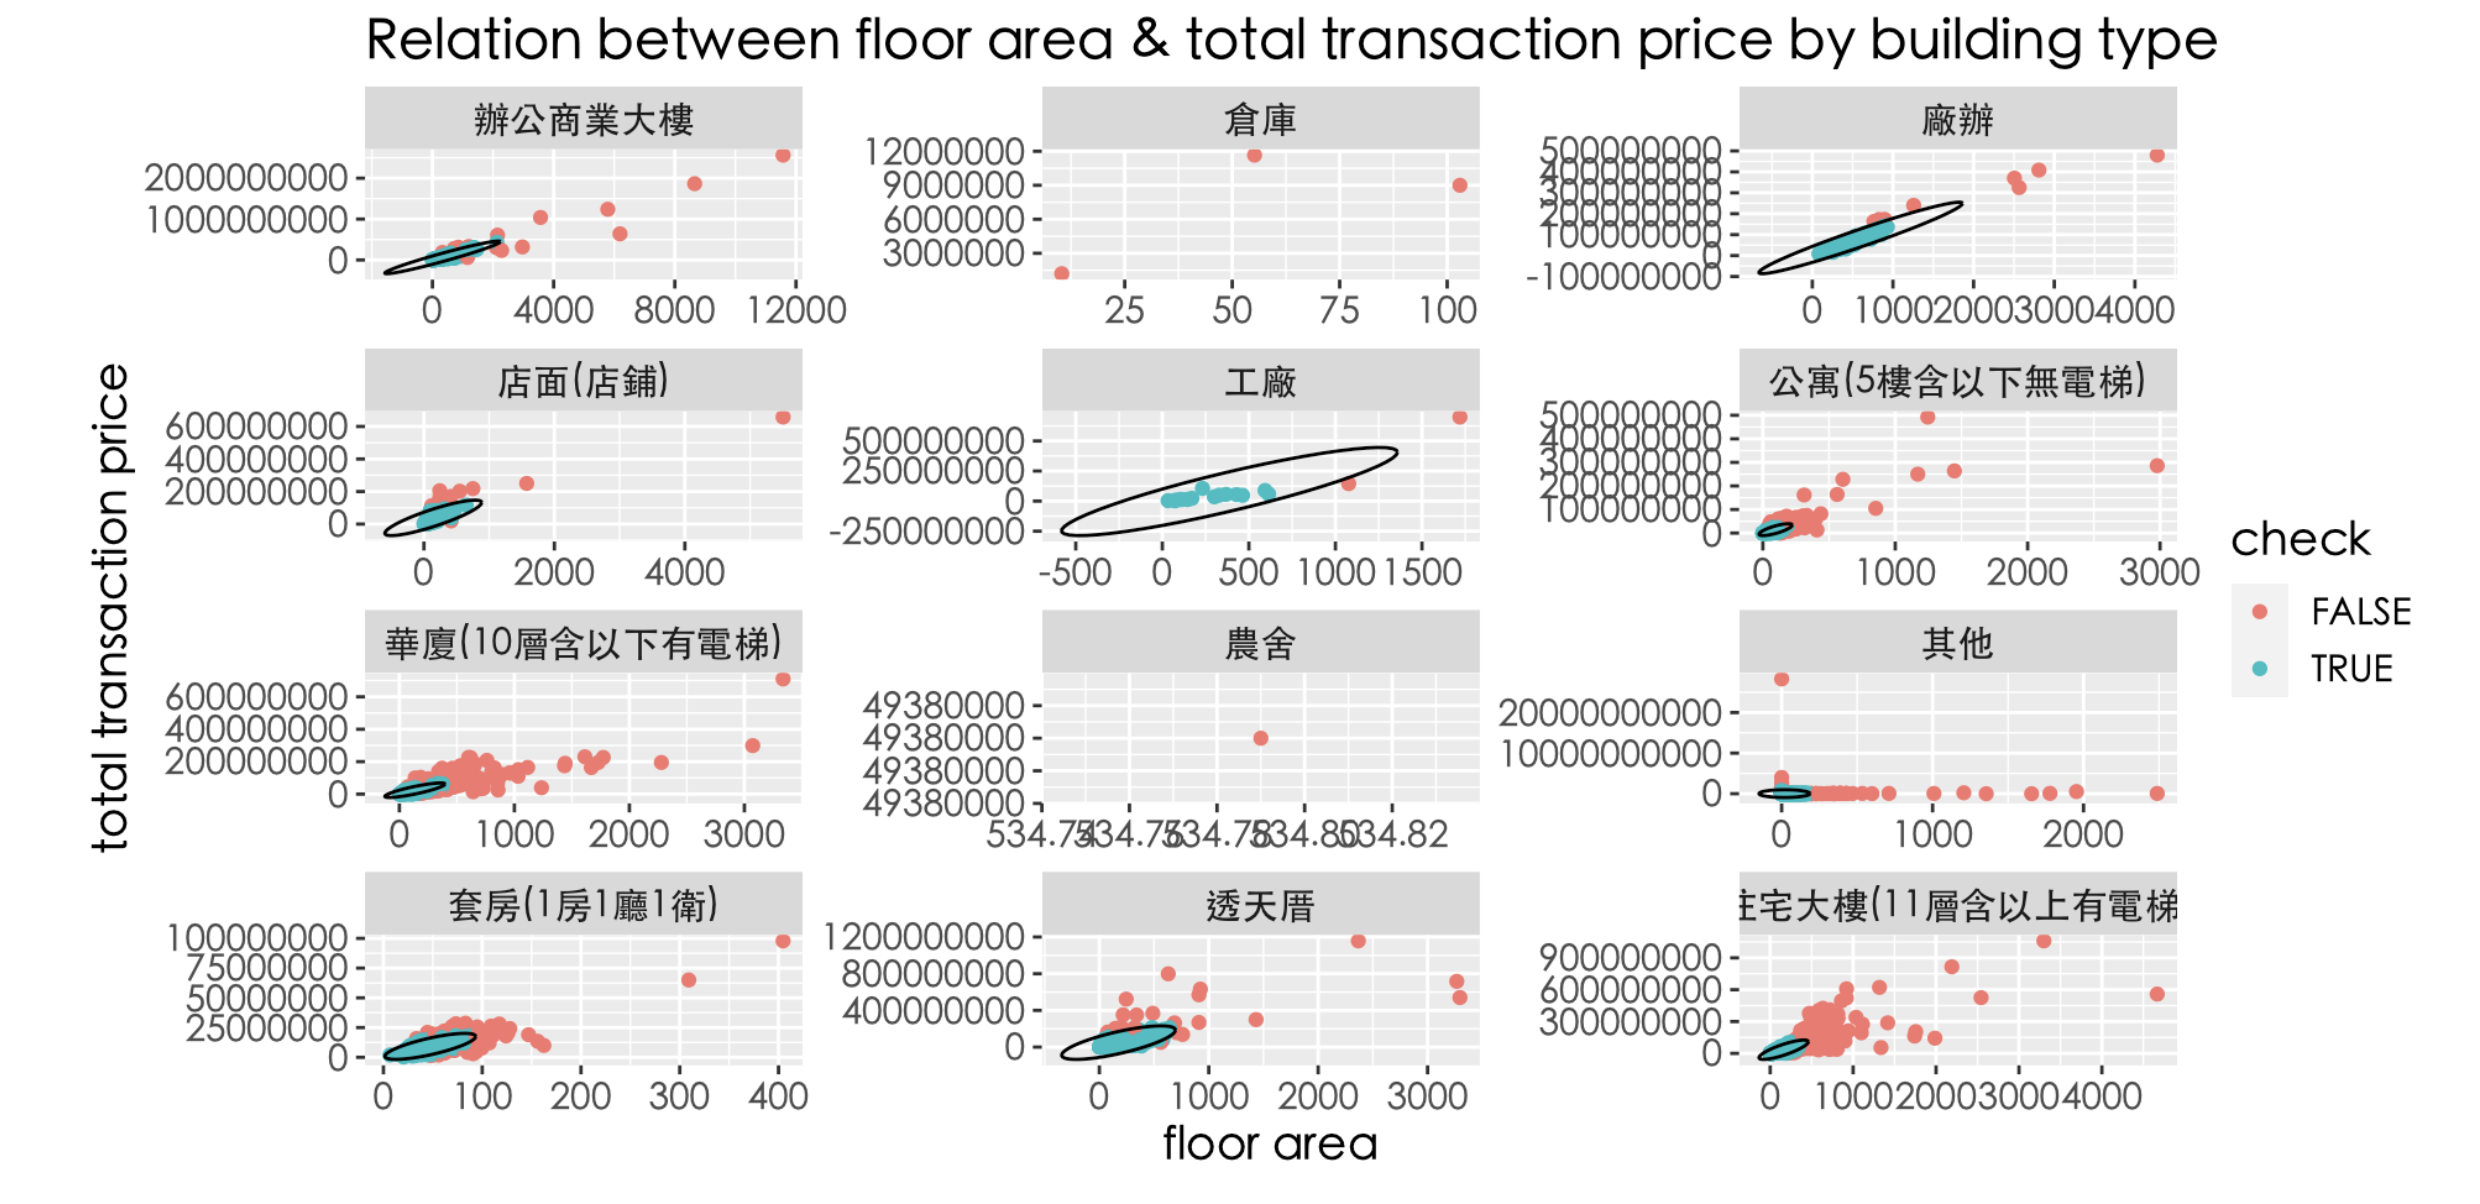
This work use R langauge to code and draw many statistical charts. In this project, I found in house price, the outlier’s geogrpahical variance is the most distinguishable in 住宅大樓,the hot spot is 中山區 followed by 大安區、信義區。 in type of 公寓,hotspot is in 北投區。in type of 套房,hotspot is in 中正區。in type of 華廈,the hot spot is in 大安區 follwed by 內湖區。in 商業辦公大樓,hotspot is in 中山區。in 透天屋,the hot spot is in 北投區。
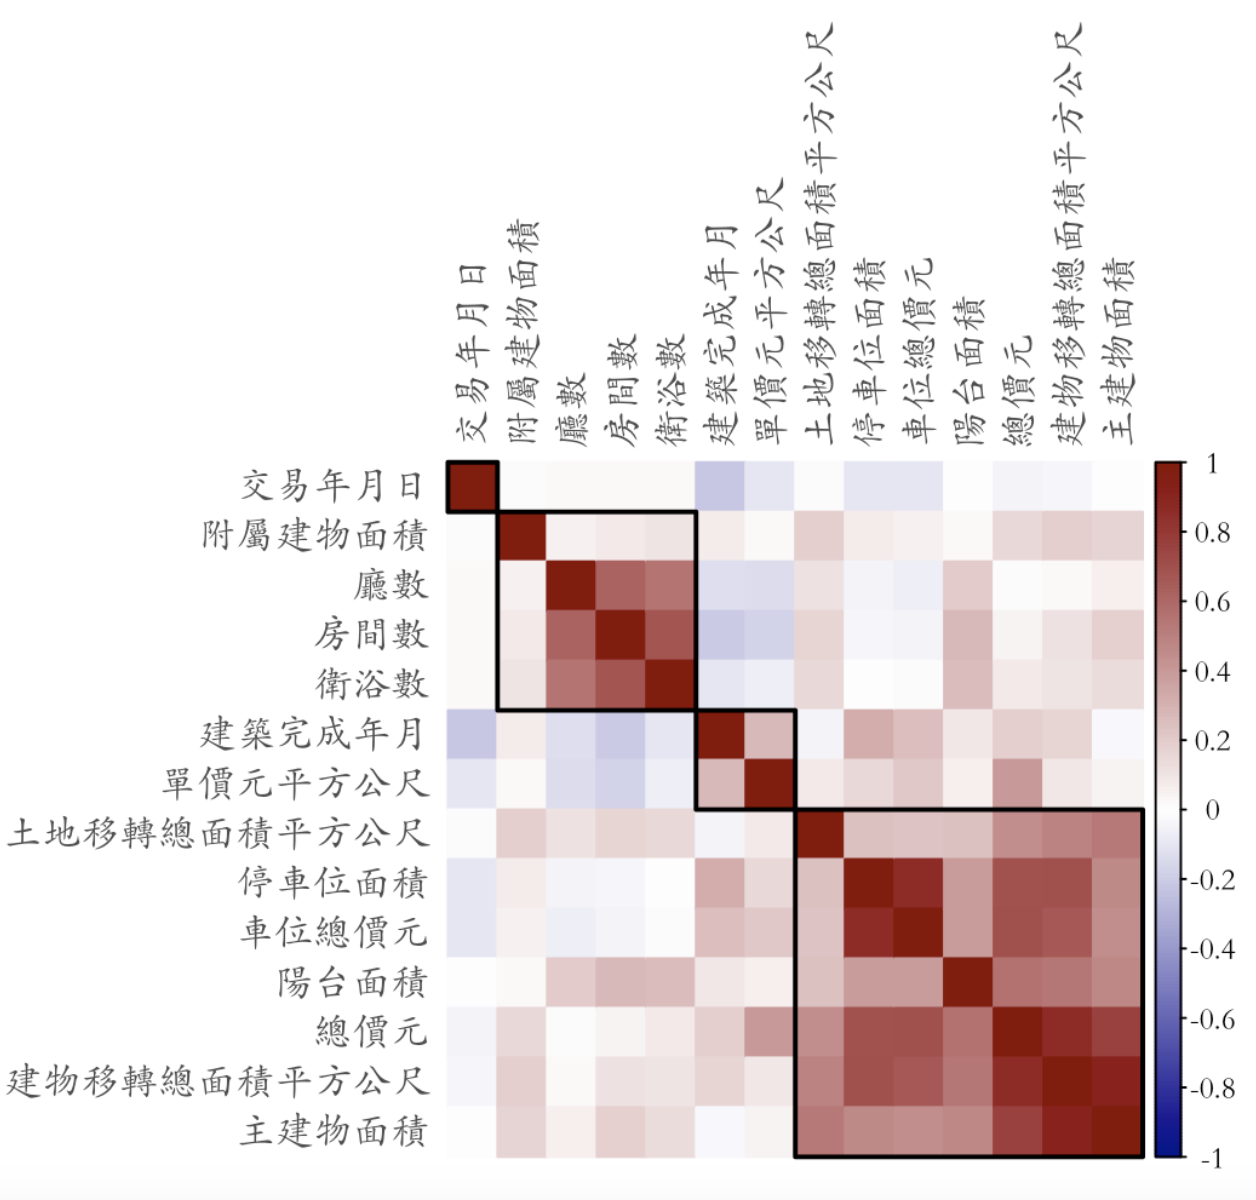
2021-1 Spatiotemporal Data Visualization - Project 3: Factors of High House Price in Taipei
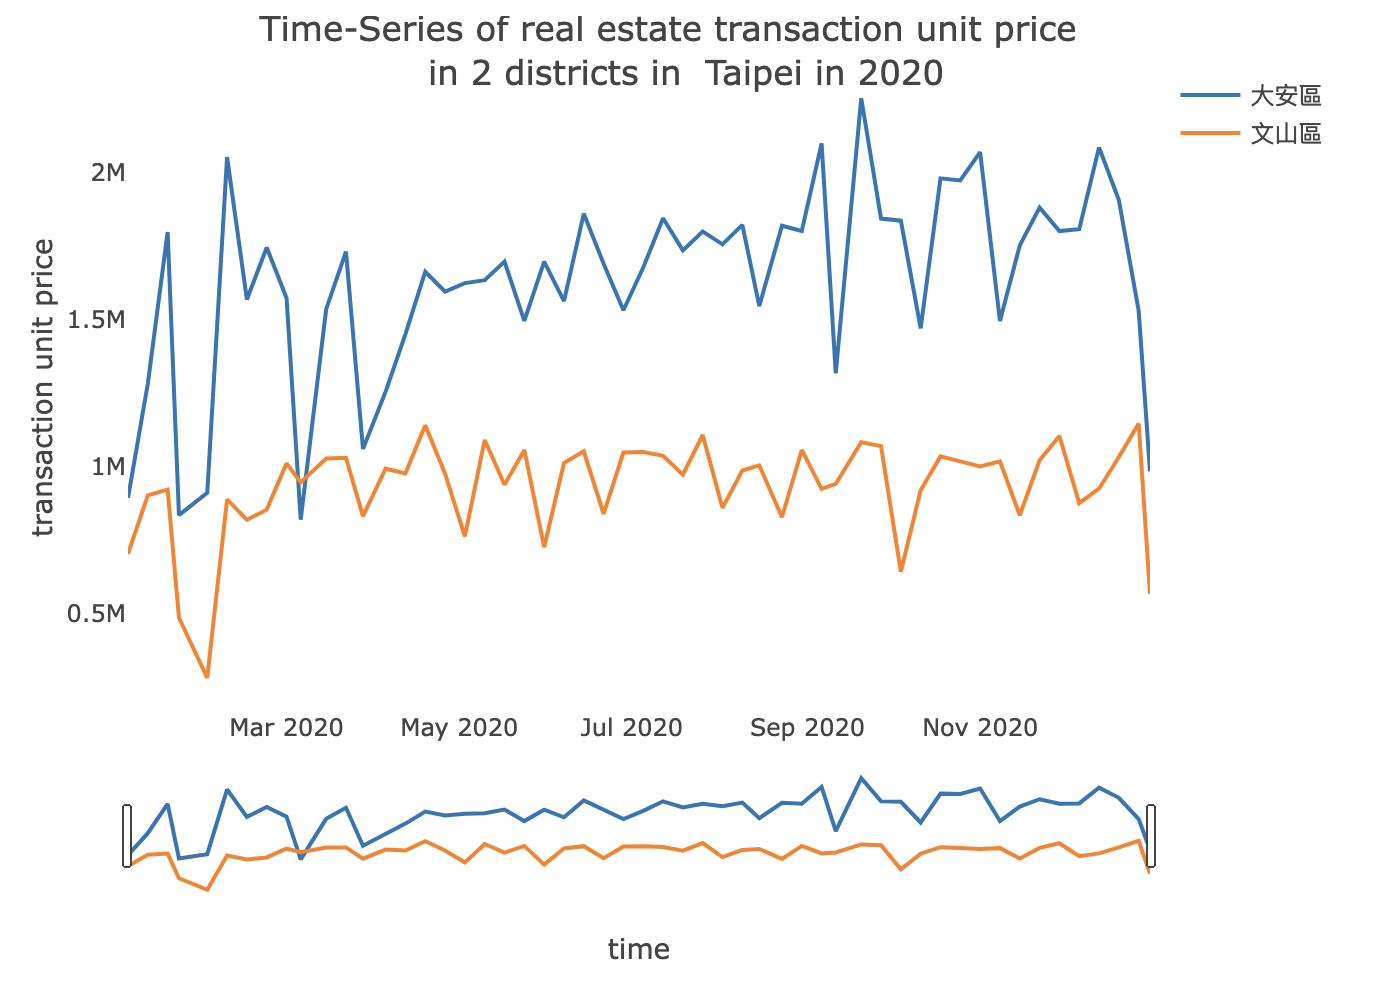
Gerally speaking, Daan district possess higher unit price in real estate transaction in 2020 than Wenshan district in Taipei city, Taiwan. However, during some short period of time, for example, 1st-15th,March, the average unit prices in transaction in Wenshan district is higher the Daan’s ones.
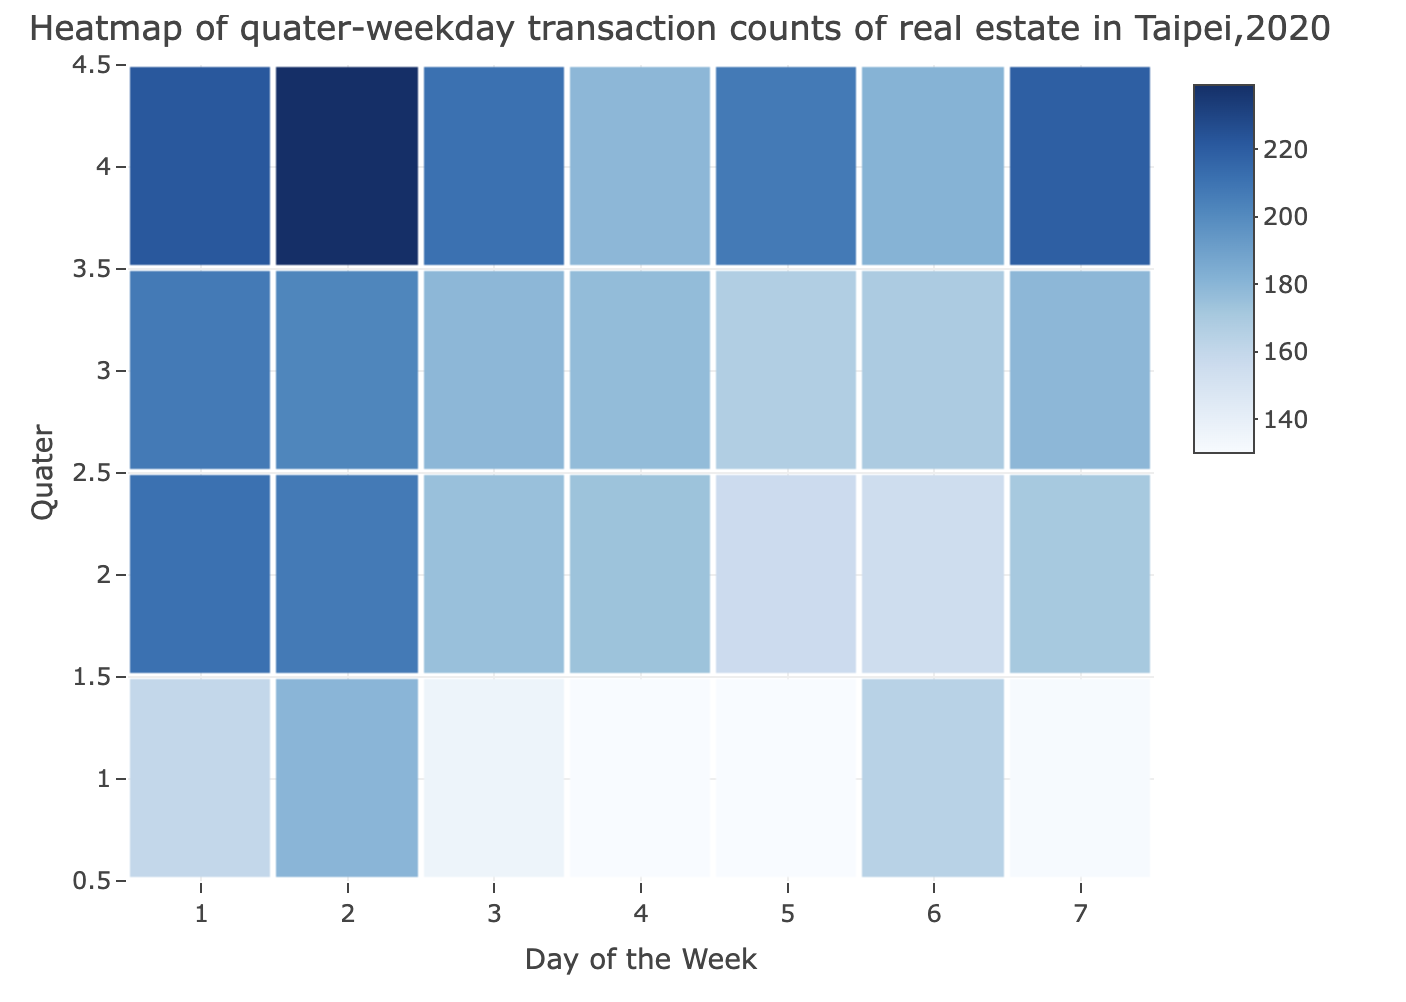
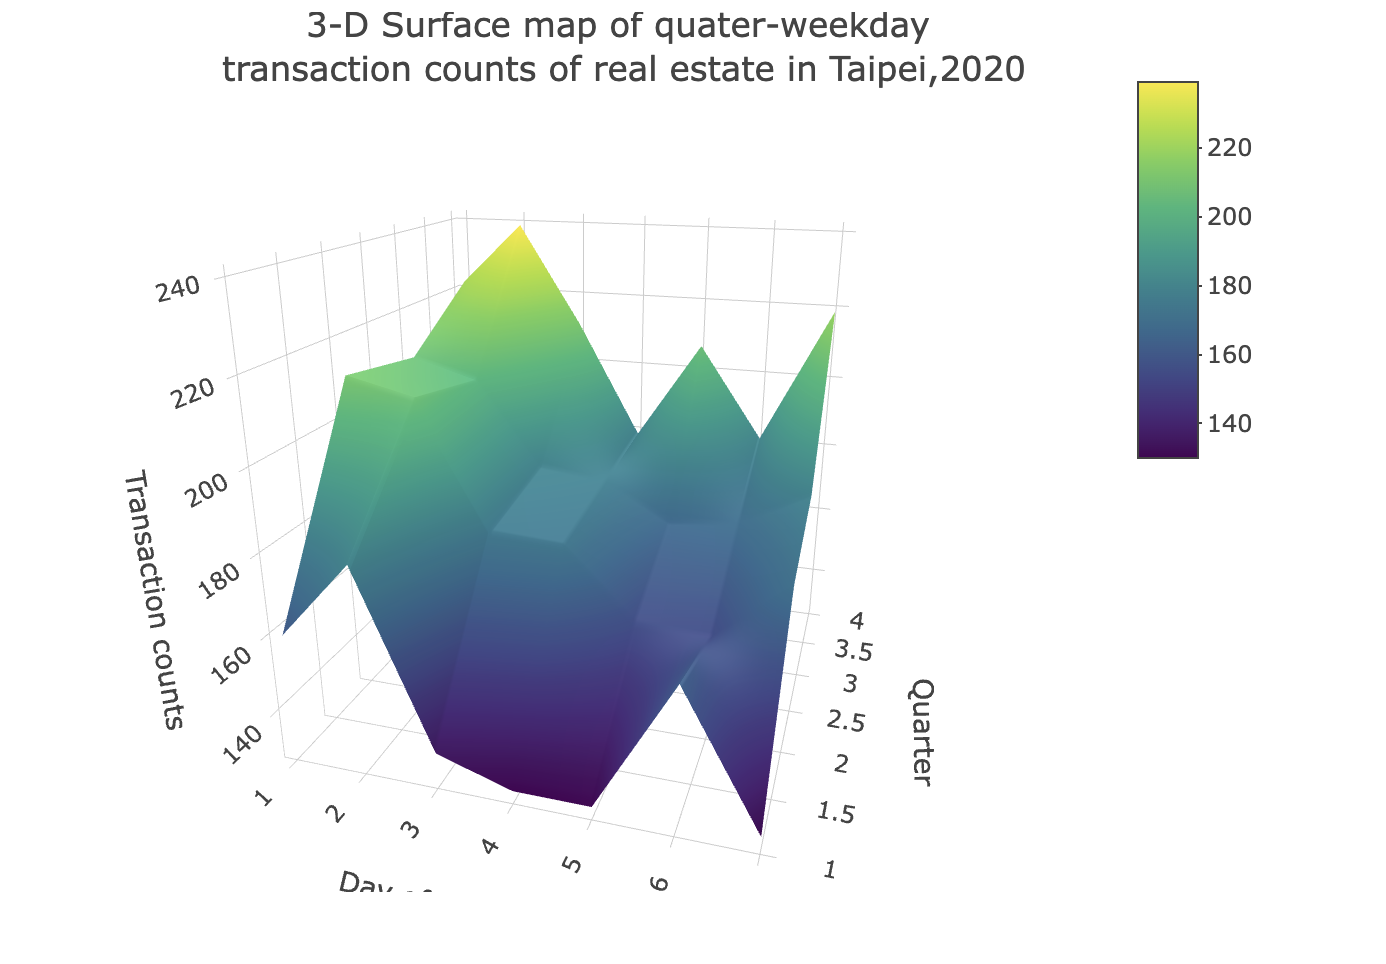
Real estate transaction in Taipei city, in 2020. The 4th quater, which is Oct-Dec,2020, possess higher count of transaction. The transaction has higher frequency occured in Sunday and Monday. This may be something to do the fact that most of people check and consider the house or dealing with real estate agent during weekends (free day). Accordinly, the time-series of transactions of quater and weekday result in this kind of characteristic.
2021-1 Spatiotemporal Data Visualization - Project 4: Time series analysis of House Price in Taipei
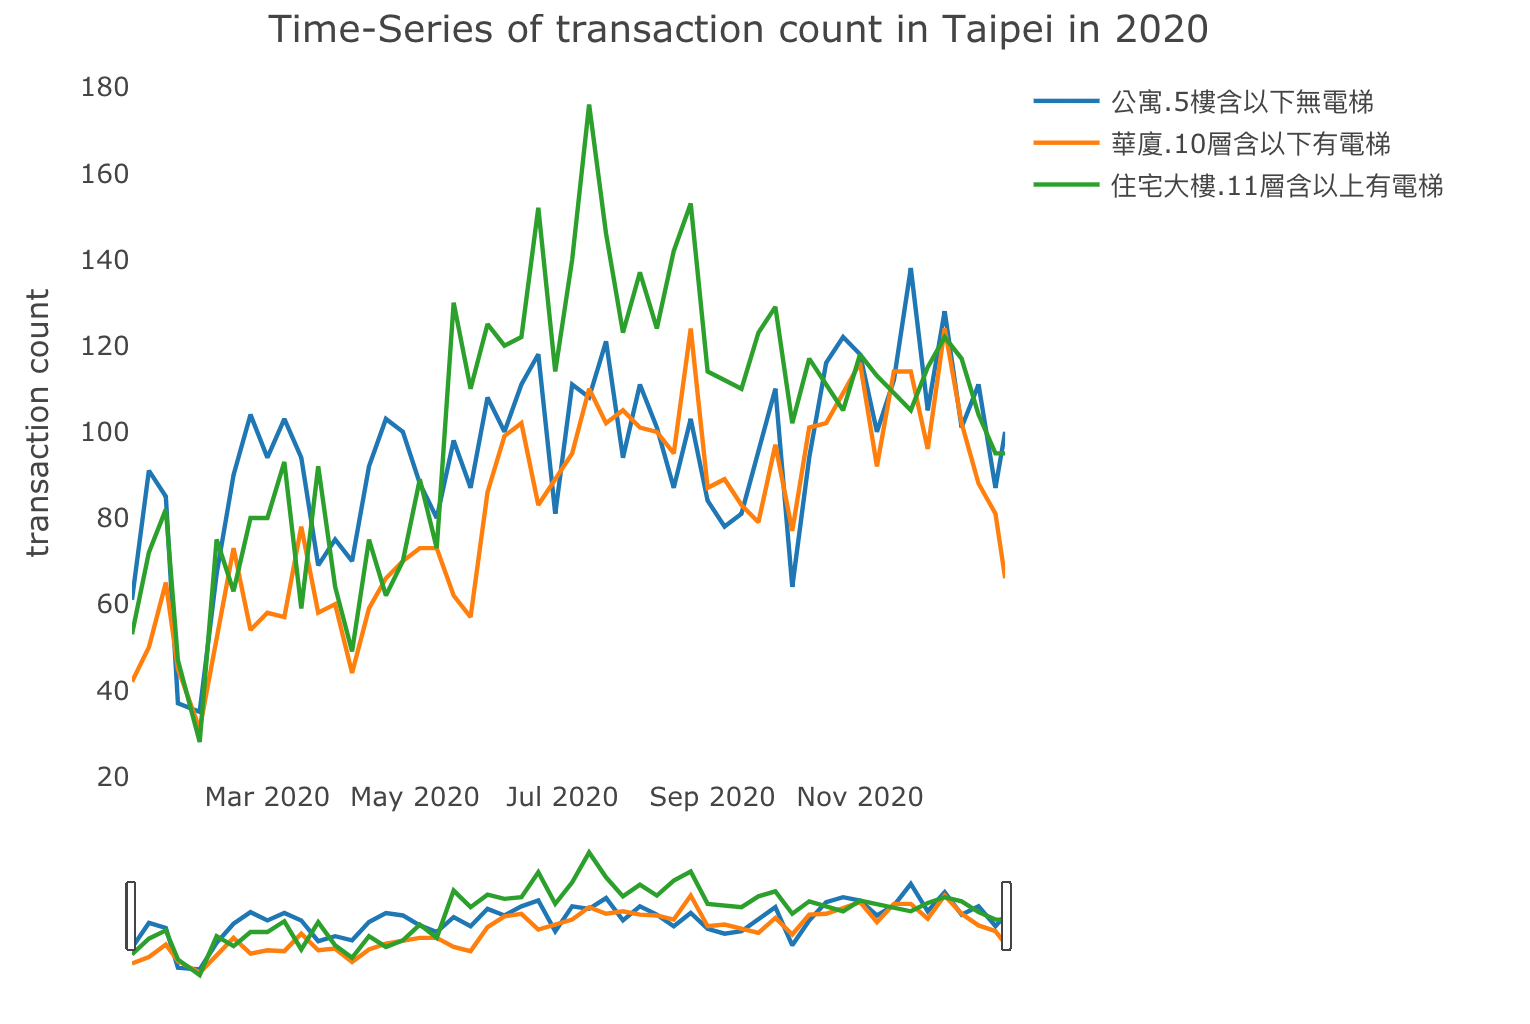
2021-1 Spatiotemporal Data Visualization - Project 4-2: Time series analysis of House Price of different types in Taipei
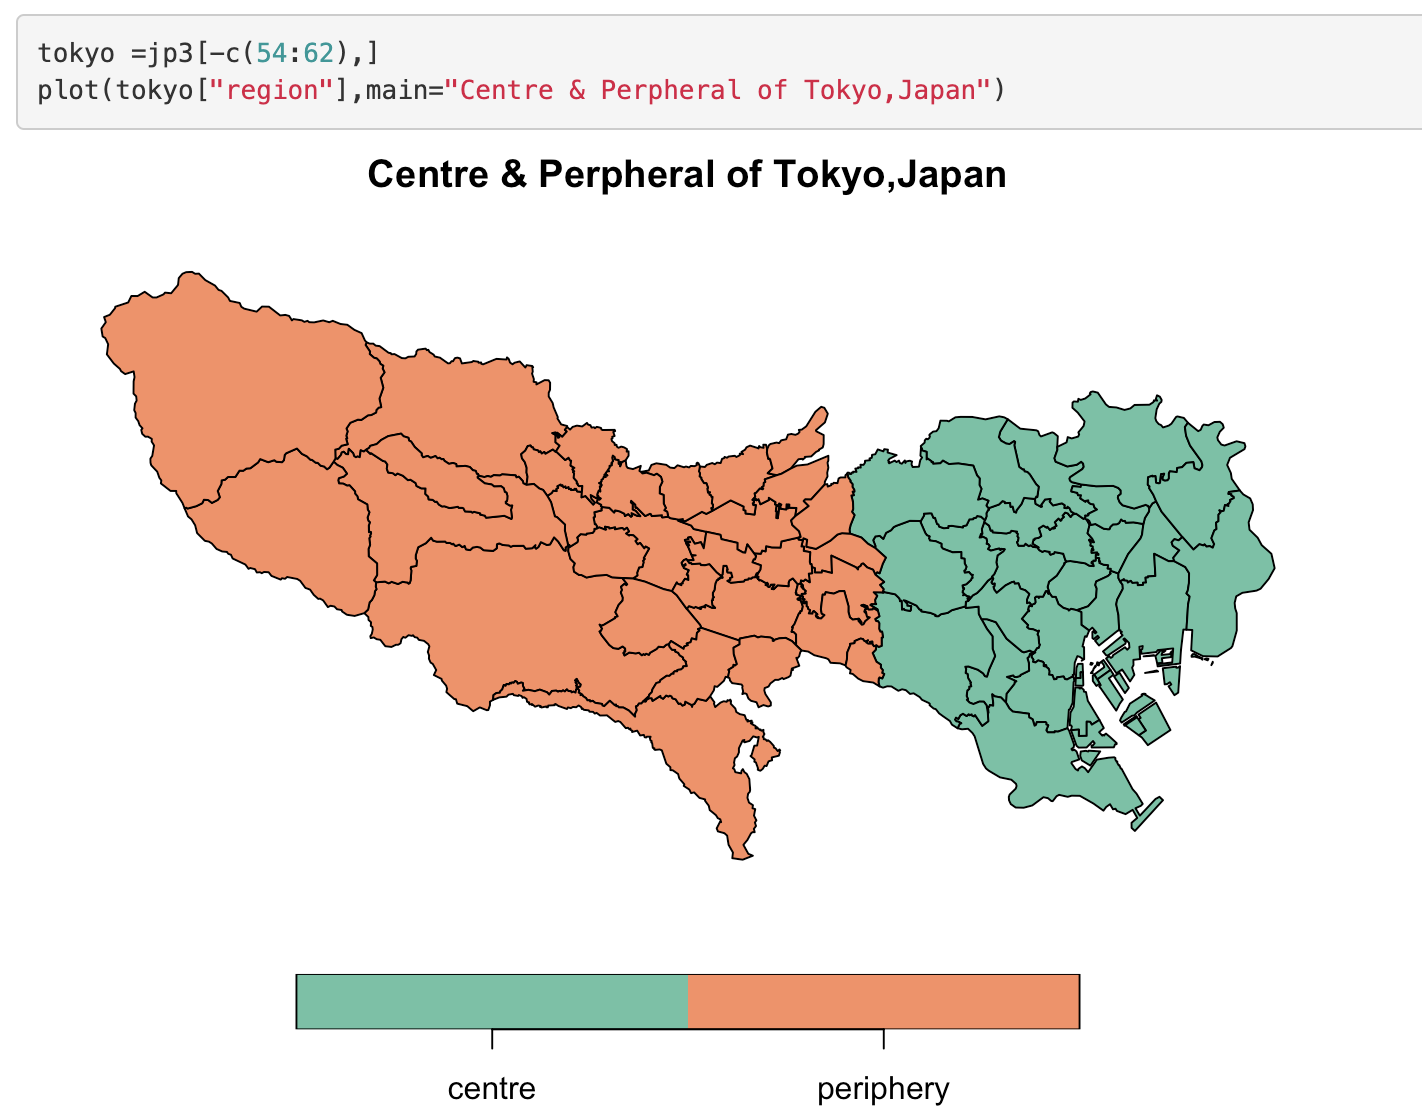
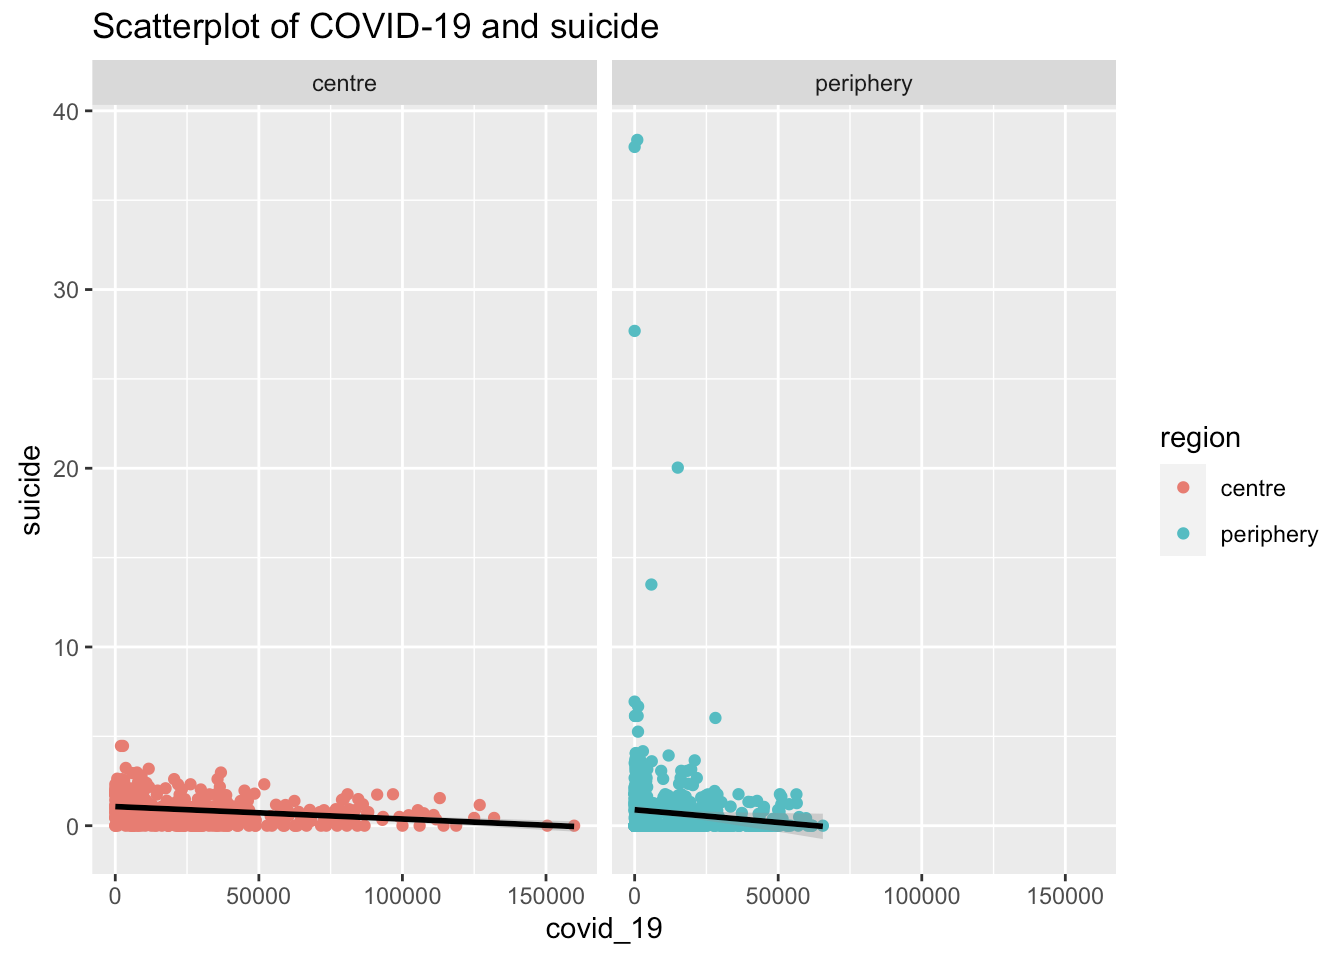
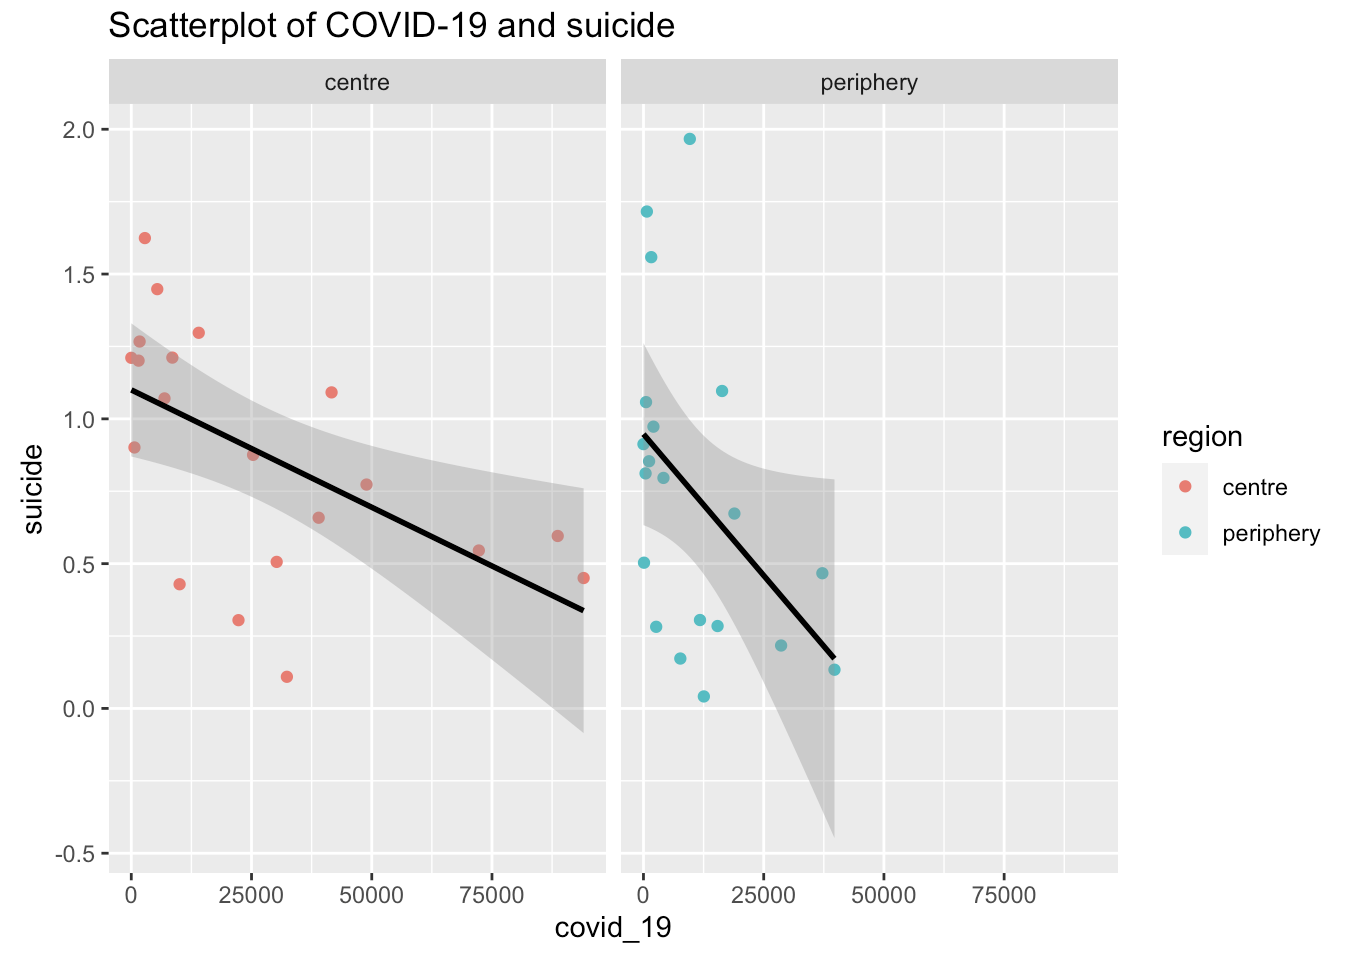
In this work, I wonder Question 1: In Tokyo, Japan, did regions with high COVID-19 cases lead to high suicide rate ? Question 2: Did the relationship of COVID-19 and suicide differ among centre Tokyo and Peripheral Tokyo ?
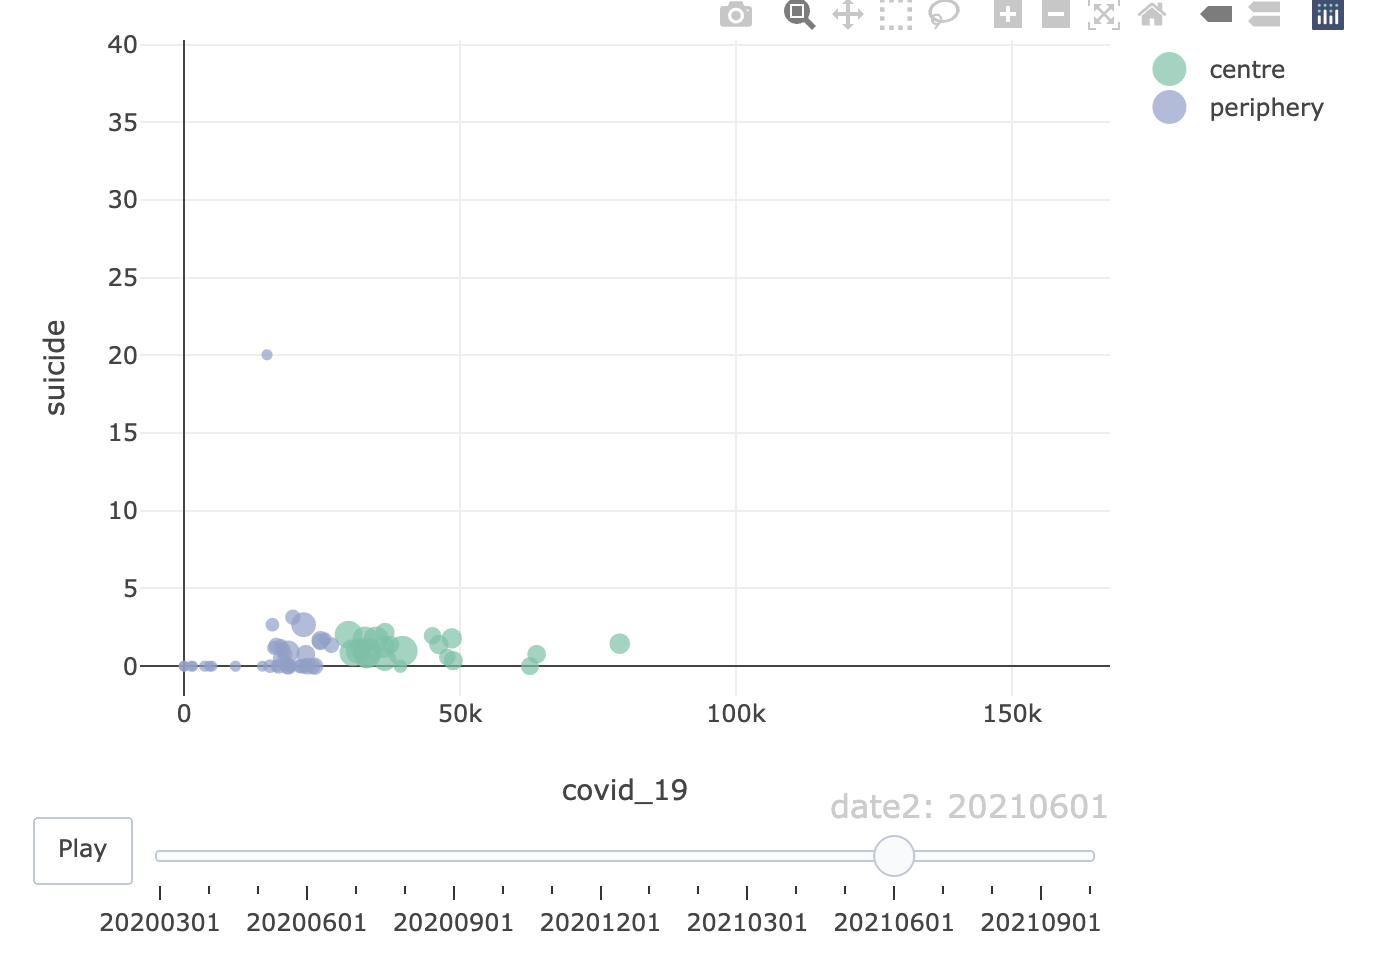
After I anlayze the data, I obtain some resuts. In the big picture, I found out that the COVID-19 cases and suicide rate are negatively related which is very surprise to me. I originally thought that the place with higher infected rate will caused uneasiness and panic leading to excessive suicide rate. However, the data analysis proved me wrong. As the difference between central and peripheral Tokyo, I found out that in most of time, COVID-19 infected rate is higher in central Tokyo. However the suicide rate change over different stage of virus outbreak. In simplified aggregated analysis, suicide rate in central Tokyo is higher than peripheral in most of the time except for 2020-Sep and 2021-Feb. However, If we see the unaggregated analysis, peripheral Tokyo has higher fluctuation of suicide rate than central Tokyo. As for possible mechanism of this phenomen, I have not found the reasonable explanation for this. However, I think this phenomen found out by data analysis is interesting and worth dig deeper.
2021-1 Spatiotemporal Data Visualization - Project 5: COVID-19 infection rate and suicide rate in Tokyo, Japan
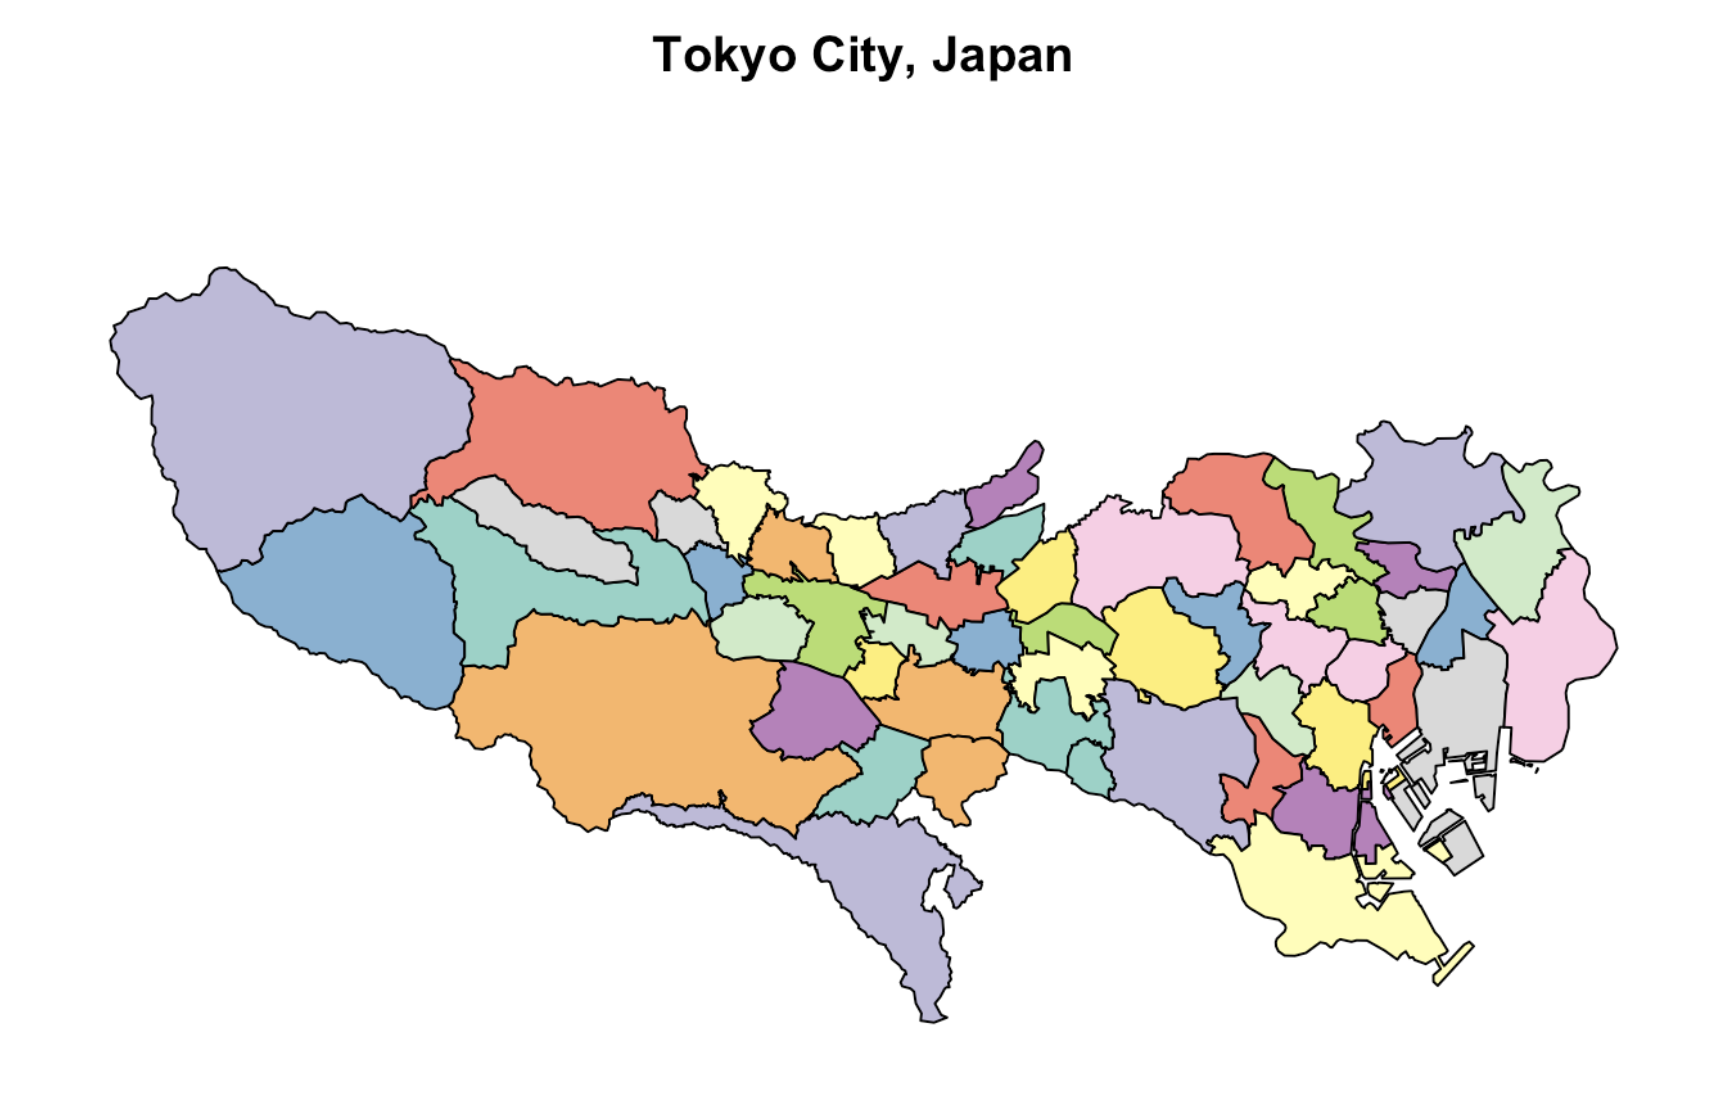
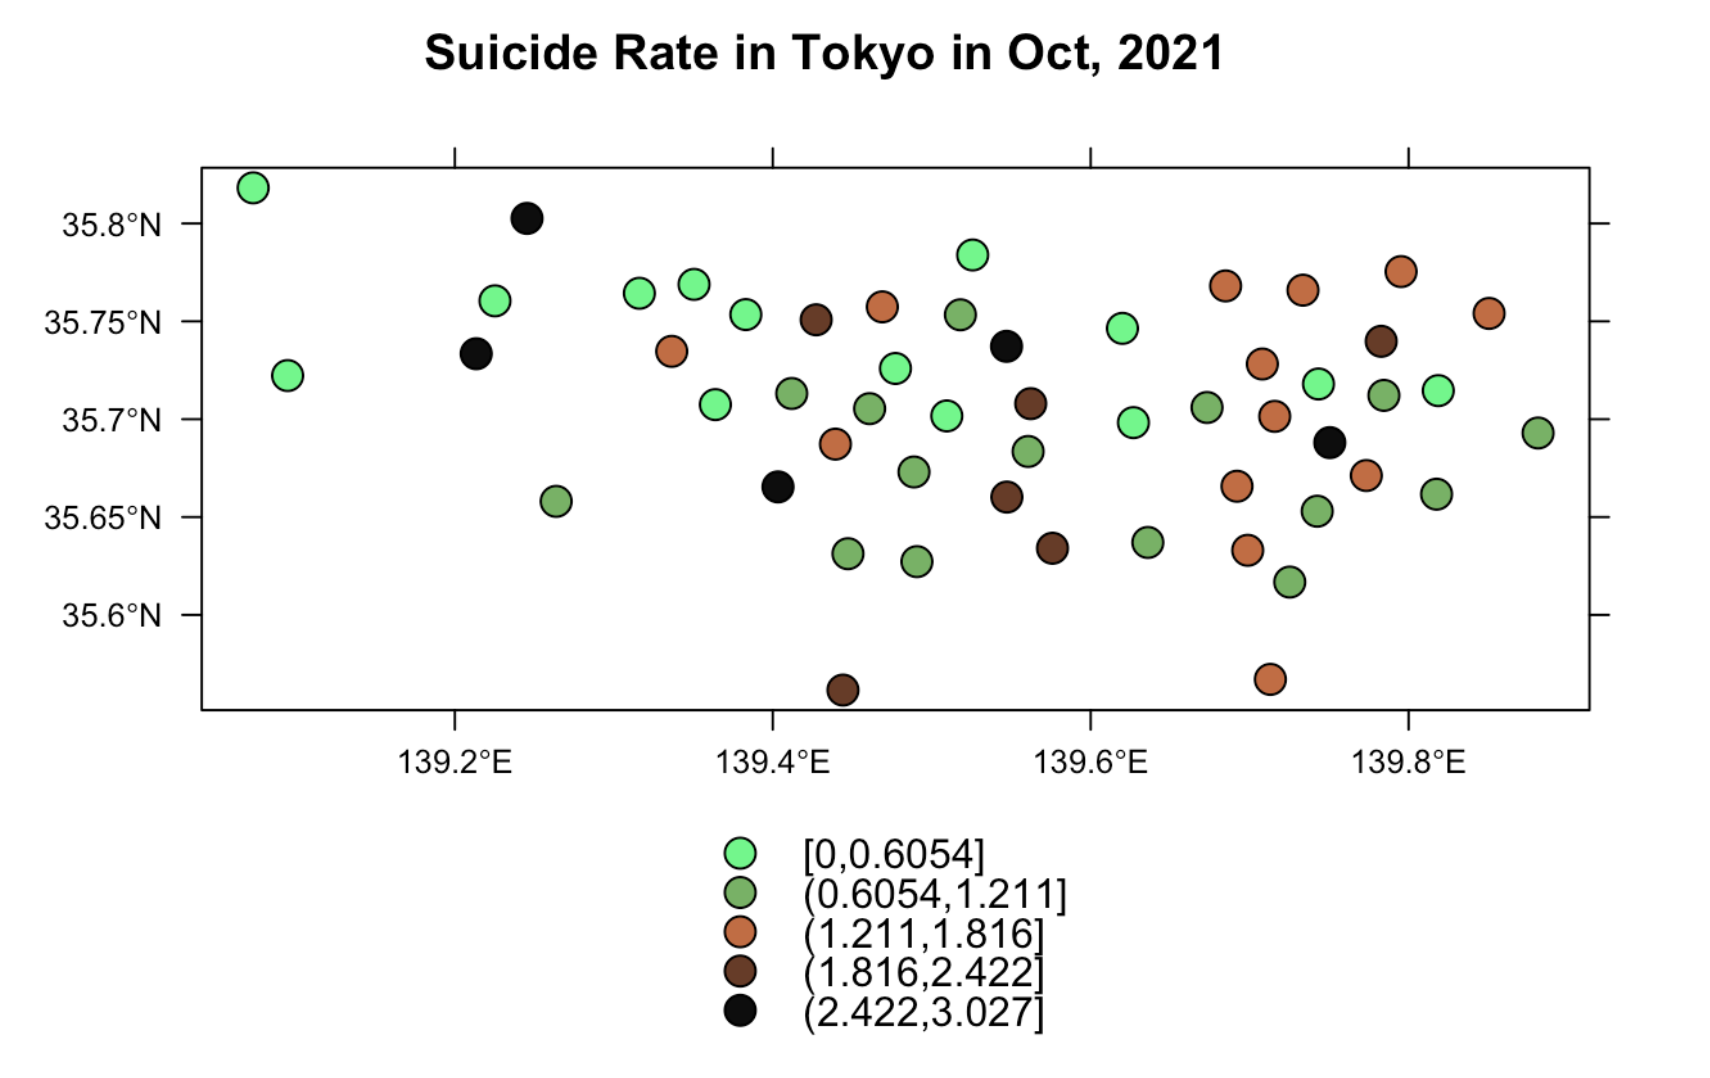
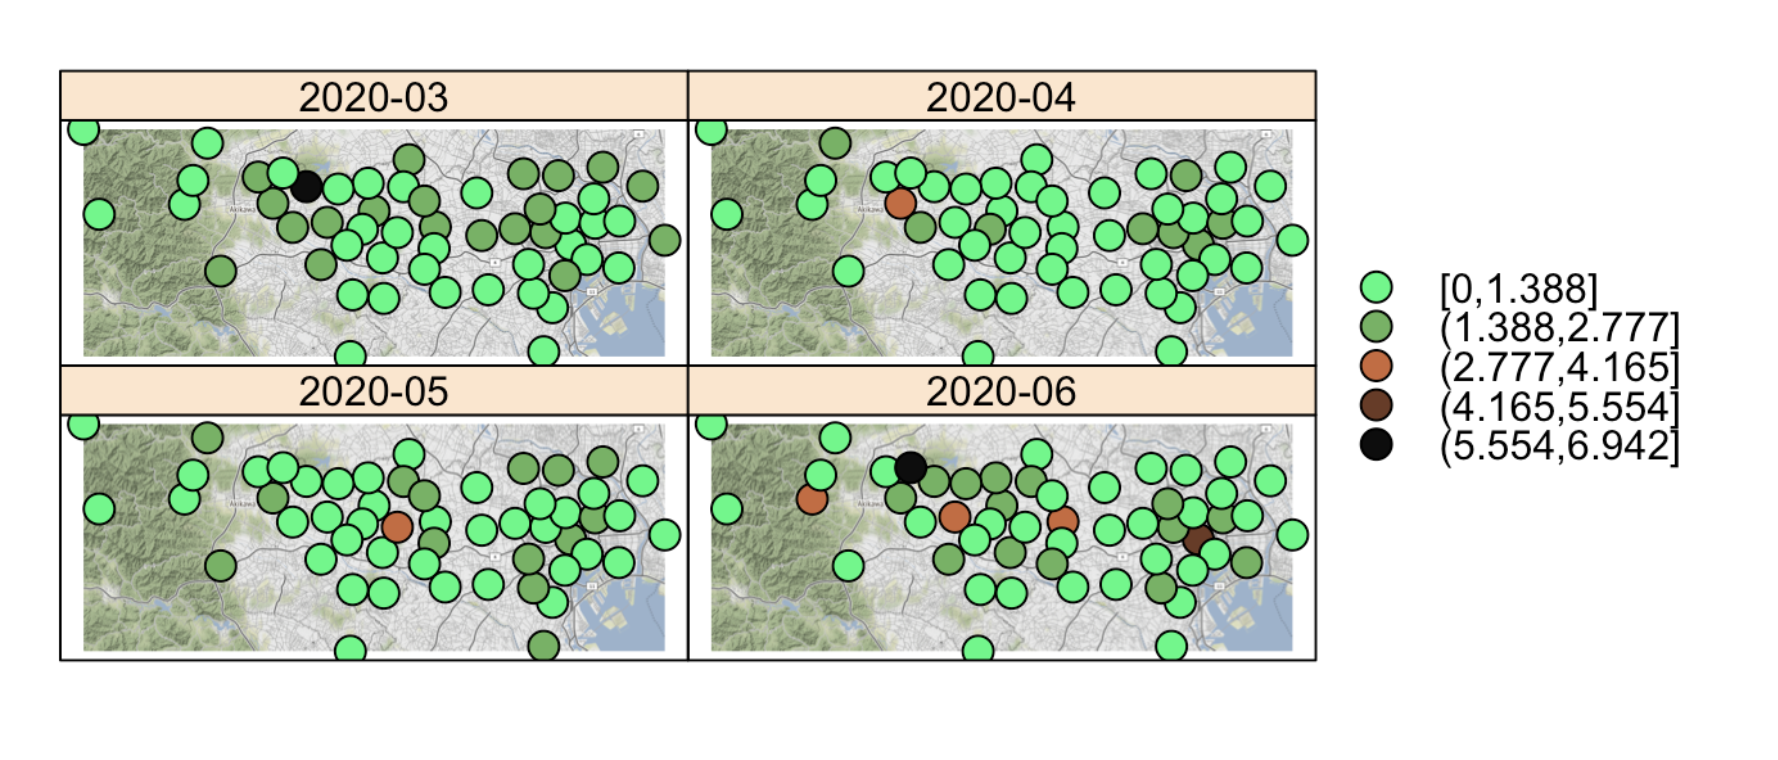
The project shows the suicide rate spatial distribution in Tokyo city, Japan from March, 2020 to December, 2020. COVID-19 outbreak began in March, 2020 and still happening. We can view March-June, 2020 as the 1st wave of virus outbreak and July-December, 2020 as 2nd wave of virus outbreak. As we can see in the figure, the suicide rate is the highest in the west and middle tokyo in the first wave and there are some place in the DOWNTOWN tokyo begin to possess high suicide rate in the 2nd wave.
This is an intriguing discovery. The suicide rate hotspot (high value location) shift along with the different stage of pandemic. In COVID-19 cases in Tokyo city, Japan, the suicide rate hotspot expand from ruralTokyo (east and middle Tokyo) to urban, downtown Tokyo (west and harbor area). This phenomen may be explained by the the possibilitythat the downtown is more affected by COVID-19 due to high population density.
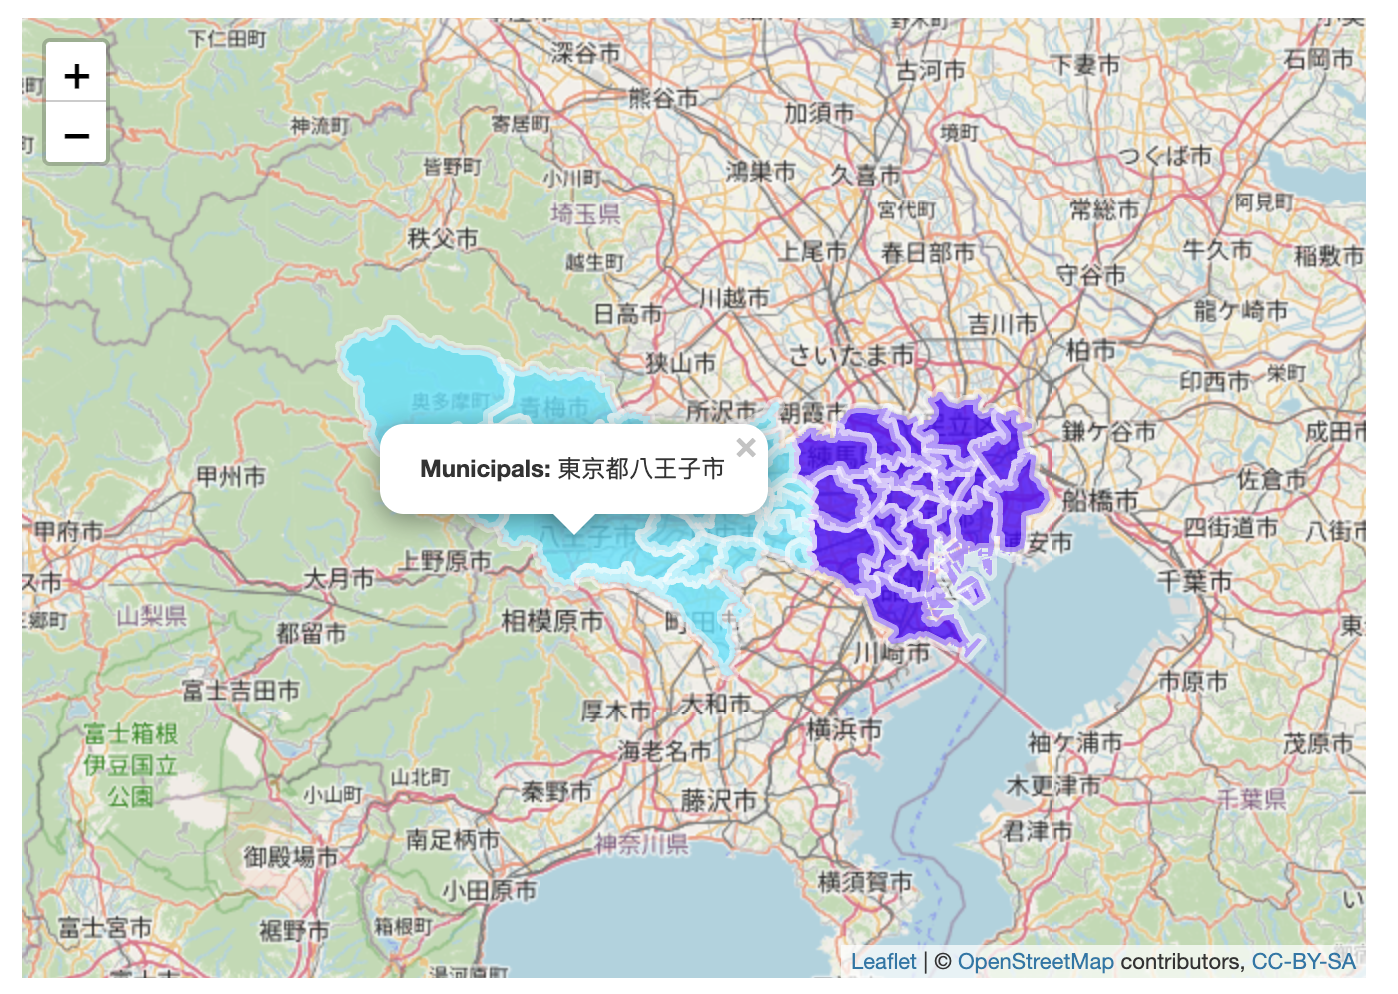
2021-1 Spatiotemporal Data Visualization - Project 6: Suicide Rate STFDF object in Tokyo, Japan
I joined Geographical Information Science Lab in the Department of Geography in National Taiwan University. My academic supervisor is Professor Tzai-Hung Wen, Ph.D.
Any cooperation or suggestion is welcome to me. E-mail is on school system. Phonenumer and the Address is Geography Department of National Taiwan University
Since 7,August 2019 (Wed)